Analytics
Grafana-based Dashboards
Applications
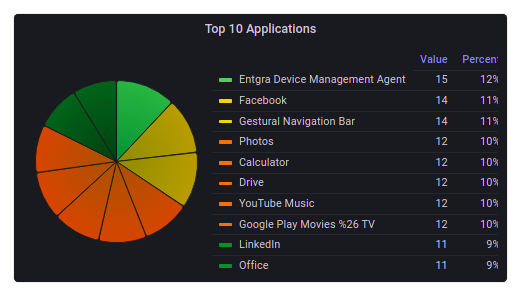
Top 10 Apps in Devices
This pie chart presents the top 10 most installed apps in the device fleet. As such, this can be used to see and identify the most popular trending apps within the fleet.
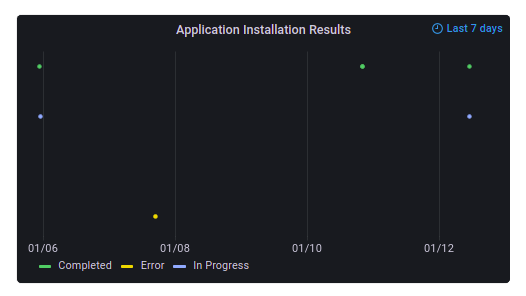
Application Installations Results
This chart shows the status of the application installation process over a period of 7 days.
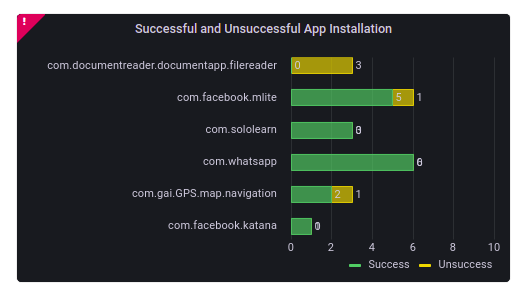
App Installation Success Rate
This chart shows the number of successful and unsuccessful app installations.
Device Inventory
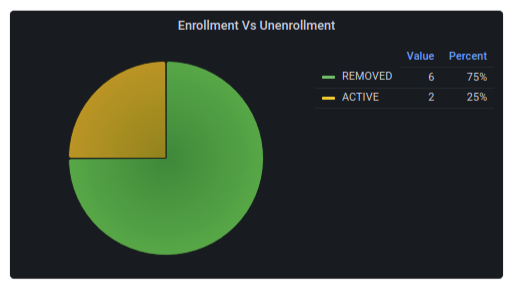
Enrollments vs Unenrollments
This report indicates the number of device enrollments and unenrollments performed.
Device Type
The device type chart displays the onboarded devices under Android, iOS, and Windows.
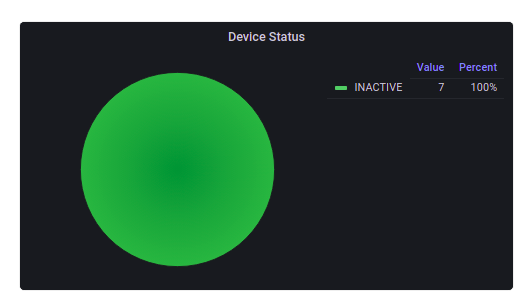
Device Status
The device status chart indicates the number of devices available under the Inactive, Active, and Unreachable statuses.
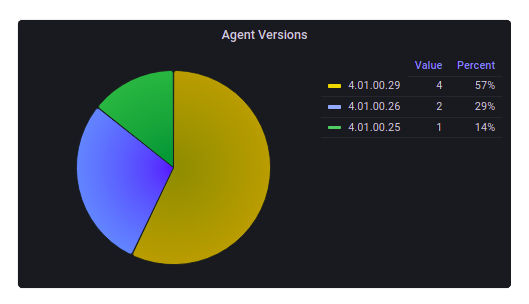
Agent Version
Displays the different agent versions that are installed on the devices.
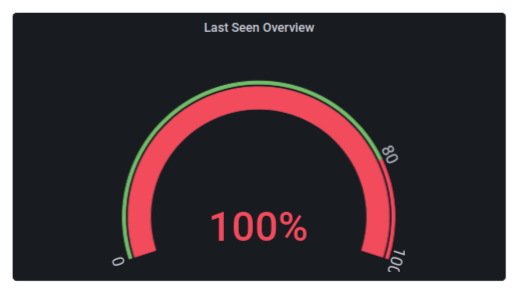
Last Seen Overview
This shows the device count of devices' last seen update over a given period of time.
Device Hardware
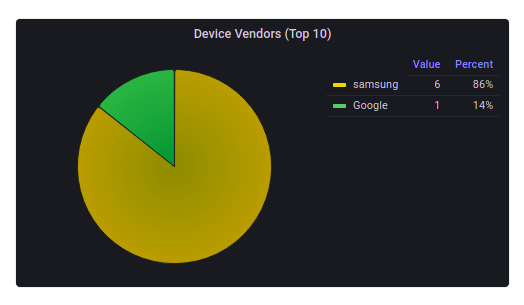
Device Vendors
This pie chart shows the number of devices under different device types.
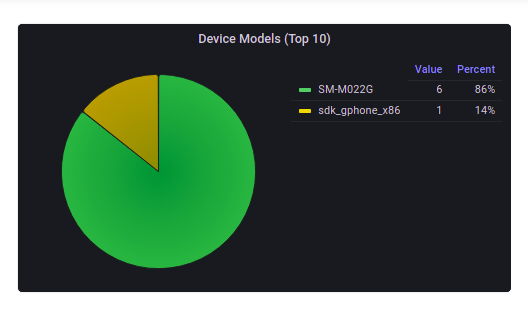
Device Models
This chart is based on the device models of the enrolled devices.
Device Firmware
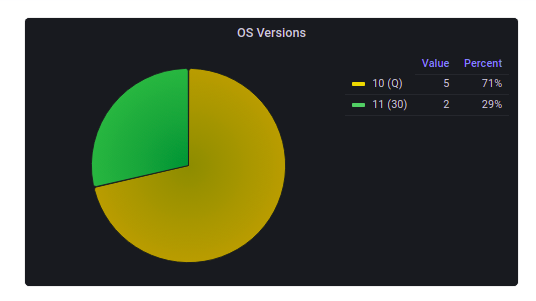
OS Versions
This chart can be used to see the OS versions of the devices and the number of devices under each OS version.
Device Connectivity
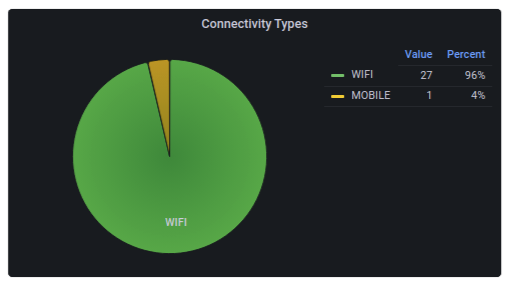
Connectivity Type
This shows the number of WiFi and mobile devices by connectivity. Clicking on each will take you to the corresponding connectivity page.
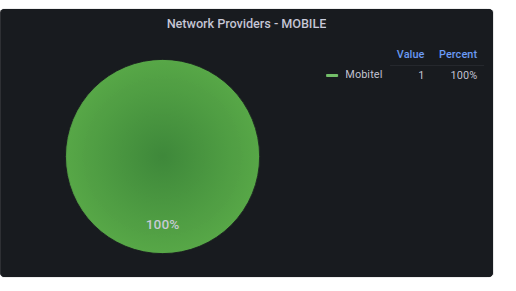
Network Provider
Displays the number of different operators available for either mobile or WiFi devices. By default, MOBILE is displayed. By changing the connection type in the search filter you can see the number of devices for WiFi devices. Clicking on an operator will take you to the relevant connectivity page depending on the selected connection type in the search filter.
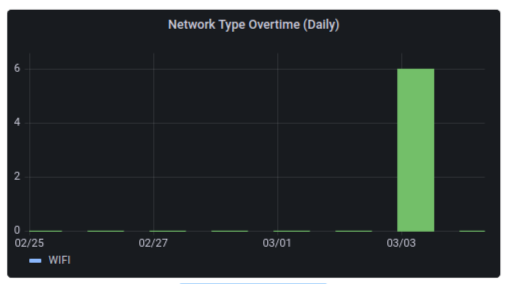
Network Type Daily
Shows the number of mobile and WiFi devices that were available during the last 7 days. Clicking on more details will take you to the chart that will show the number of mobile and WiFi devices that were available over a given frequency of hourly, daily and monthly breakdown.
Daily Signal Strength
This shows the signal strength over time for all the operators based on the connection type selected from the search filters over the last 7 days. Clicking on more details will take you to the list of devices that are either mobile or WiFi depending on the selected connection type. By default, it shows mobile.
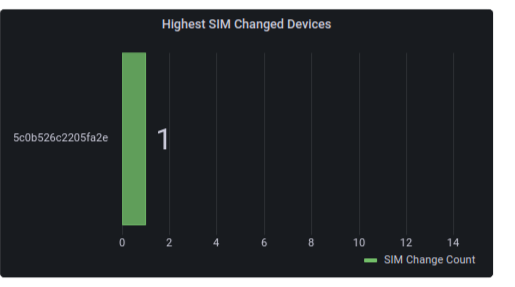
Devices with Changed SIMs
This chart shows the number of devices that had their SIM changed during the last 7 days. Clicking on more details will take you to a list of all the SIM changed devices.
Device Assignment
Device Groups
Displays the number of devices assigned to the created device groups.
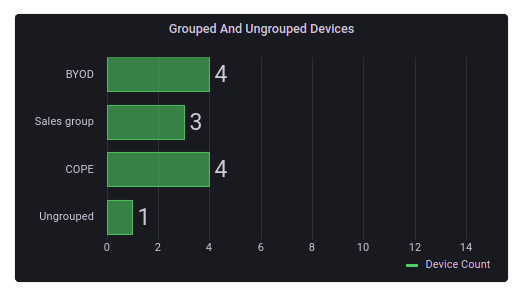
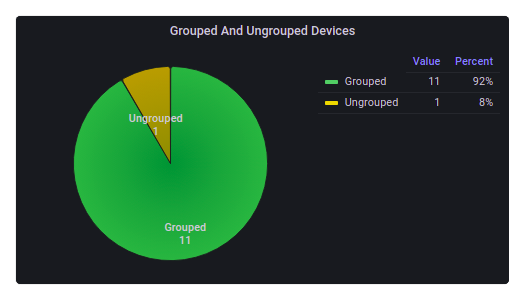
Grouped and Ungrouped Devices
This chart contains the number of grouped and ungrouped devices.

Operations
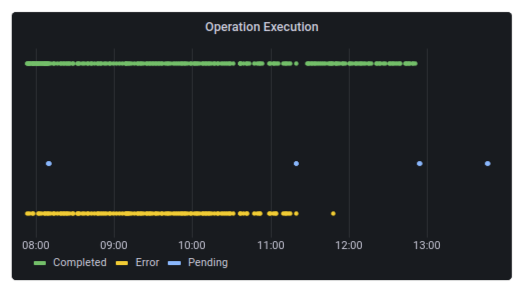
Operation Execution
This chart shows the status of the executed operations.
Success and Failed Operations
This chart indicates the number of successful and failed operations.
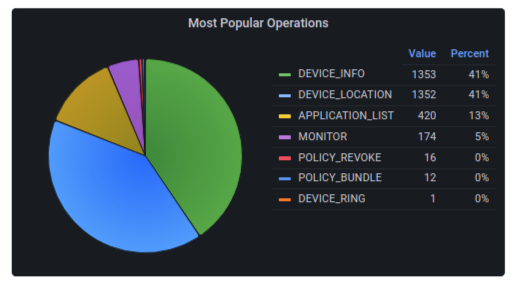
Most Popular Operations
This chart will help to identify the operations that are triggered most on the devices.
Policy
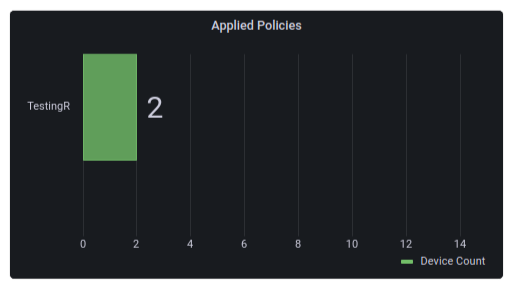
Applied Policies
Using this chart the user can get a device count of the devices which have the published policies applied to them.
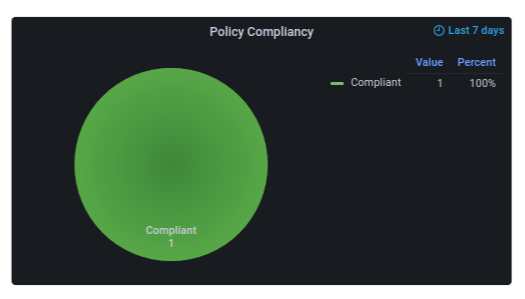
Policy Compliancy
This indicates the number of policies that are compliant and non-compliant in the devices.